
TL;DR: Inference is the factory that turns a trained model into a live answer. Wafer reports 1.31x to 1.92x kernel gains across disclosed AMD configurations, while RunInfra's tightly scoped H100 sweep found only a 1.02x throughput difference between vLLM and SGLang at concurrency 256.[2][6] OpenRouter now makes the commercial pressure visible: one DeepSeek V4 Flash provider snapshot spanned 8.80x on input price and 13.21x on output price, but promotions, precision, routing eligibility, and service quality mean the lowest rate is not automatically the cheapest useful answer.[13]
Most people experience an AI model as a text box. A prompt goes in. An answer comes out. That interface hides a small industrial miracle: billions of model weights must be read, calculations must be scheduled across an accelerator, conversational state must remain available, and the next token must arrive quickly enough to feel alive.
That hidden system is inference. Training creates the model. Inference operates it. If training writes the recipe, inference is the kitchen trying to serve thousands of different orders without wasting its ovens, ingredients, or staff.
Why This Matters Now
Models are spreading faster than efficient serving implementations. New attention variants, mixture-of-experts layouts, quantization formats, and accelerator generations keep changing the ideal execution path. Wafer's KernelArena now evaluates AI-generated kernels on NVIDIA B200 and AMD MI300X hardware, while RunInfra publishes condition-bounded serving sweeps across vLLM, SGLang, and TensorRT-LLM.[1][5]

Inference, ELI5: The Model Is The Recipe, Serving Is The Kitchen
A language model generates an answer by predicting one token, adding that token to the conversation, then predicting again. A token is a small unit of text. It might be a word, part of a word, or punctuation. A 500-token answer is therefore not one calculation. It is a loop that runs hundreds of times.
The loop has two broad stages. Prefill reads the prompt and builds the model's internal representation of it. Decode generates the answer one token at a time. Long documents make prefill heavier. Long answers make decode repeat more often.
The system also preserves a working memory called the KV cache. Without that cache, the model would have to rebuild all previous attention state for every new token. The cache saves work, but it consumes memory and must be routed to the right place when a conversation continues.
How A Live Model Produces An Answer
The model supplies the learned weights. The inference system decides how those weights become a response under real traffic.
Process the prompt
Tokenize the request and run prefill across its existing context.
Keep working state
Store attention state so the next token does not start from zero.
Dispatch GPU work
Run specialized programs for matrix multiplication, attention, normalization, routing, and sampling.
Emit and repeat
Choose one token, stream it, then repeat until the answer is complete.
Here is the uncomfortable truth: “model speed” is not a stable property of the model. It is the result of a specific model meeting specific hardware, precision, prompt length, output length, concurrency, cache policy, and decoding configuration. Change the workload and the bottleneck can move.
What A GPU Kernel Does: A Tiny Program With Fleet-Scale Consequences
A GPU kernel is a small program that performs a specific operation across a large amount of data. Matrix multiplication, attention, normalization, expert routing, and quantization all rely on kernels. The kernel decides how work is divided, how data moves through memory, and whether the accelerator's expensive compute units stay busy.
Think of it as a foreman's work order. A poor order makes workers wait for materials, repeat a handoff, or crowd the same aisle. A better order places the right material close to the right worker and eliminates unnecessary movement.
The gains compound because the same operations repeat across model layers, requests, and generated tokens. Wafer's January 2026 AMD case study is a useful example. The company says its agent optimized AITER's topk_sigmoid path using architecture documents and ISA inspection. Across 40 configurations, the published DPP-versus-CK samples range from 1.31x to 1.92x, with exact token counts, Top-K values, and FP16 or BF16 precision shown in its table.[2]
That is meaningful kernel evidence. It is not proof that an entire model endpoint becomes 1.92x faster. Communication, scheduling, cache misses, CPU overhead, and other kernels still sit in the path.
Three Different Kinds Of Performance Evidence
These figures describe different layers. They are presented separately, not as a leaderboard.
Company-reported DPP versus CK gains across disclosed AMD AITER topk_sigmoid configurations.
5,333 versus 5,235 output tok/s for vLLM and SGLang in one H100 BF16 sweep at concurrency 256.
V1 versus V0 throughput reported on named ShareGPT workloads with almost identical kernels.
The Decode Bottleneck: More Arithmetic Does Not Guarantee More Tokens
During decode, the model repeatedly reads weights and cached state to produce a small amount of new output. That can make the job memory-bound. The accelerator may have enormous theoretical arithmetic capacity while its compute units wait for data to arrive.
This is why memory bandwidth, data layout, low-precision formats, and fused operations matter. FlashInfer packages specialized attention, sampling, and mixture-of-experts kernels for serving systems. FlashAttention targets the movement and reuse patterns inside attention. DeepGEMM focuses on fast matrix multiplication across formats such as FP8, FP4, and BF16. CUTLASS and CuTe expose NVIDIA's lower-level building blocks. Triton gives engineers a higher-level language for writing custom GPU programs.[9][10]
These projects are not interchangeable companies fighting for one crown. They are layers in a fast-changing commons. vLLM and SGLang can compose them. Providers can tune around them. Chip vendors can optimize beneath them.
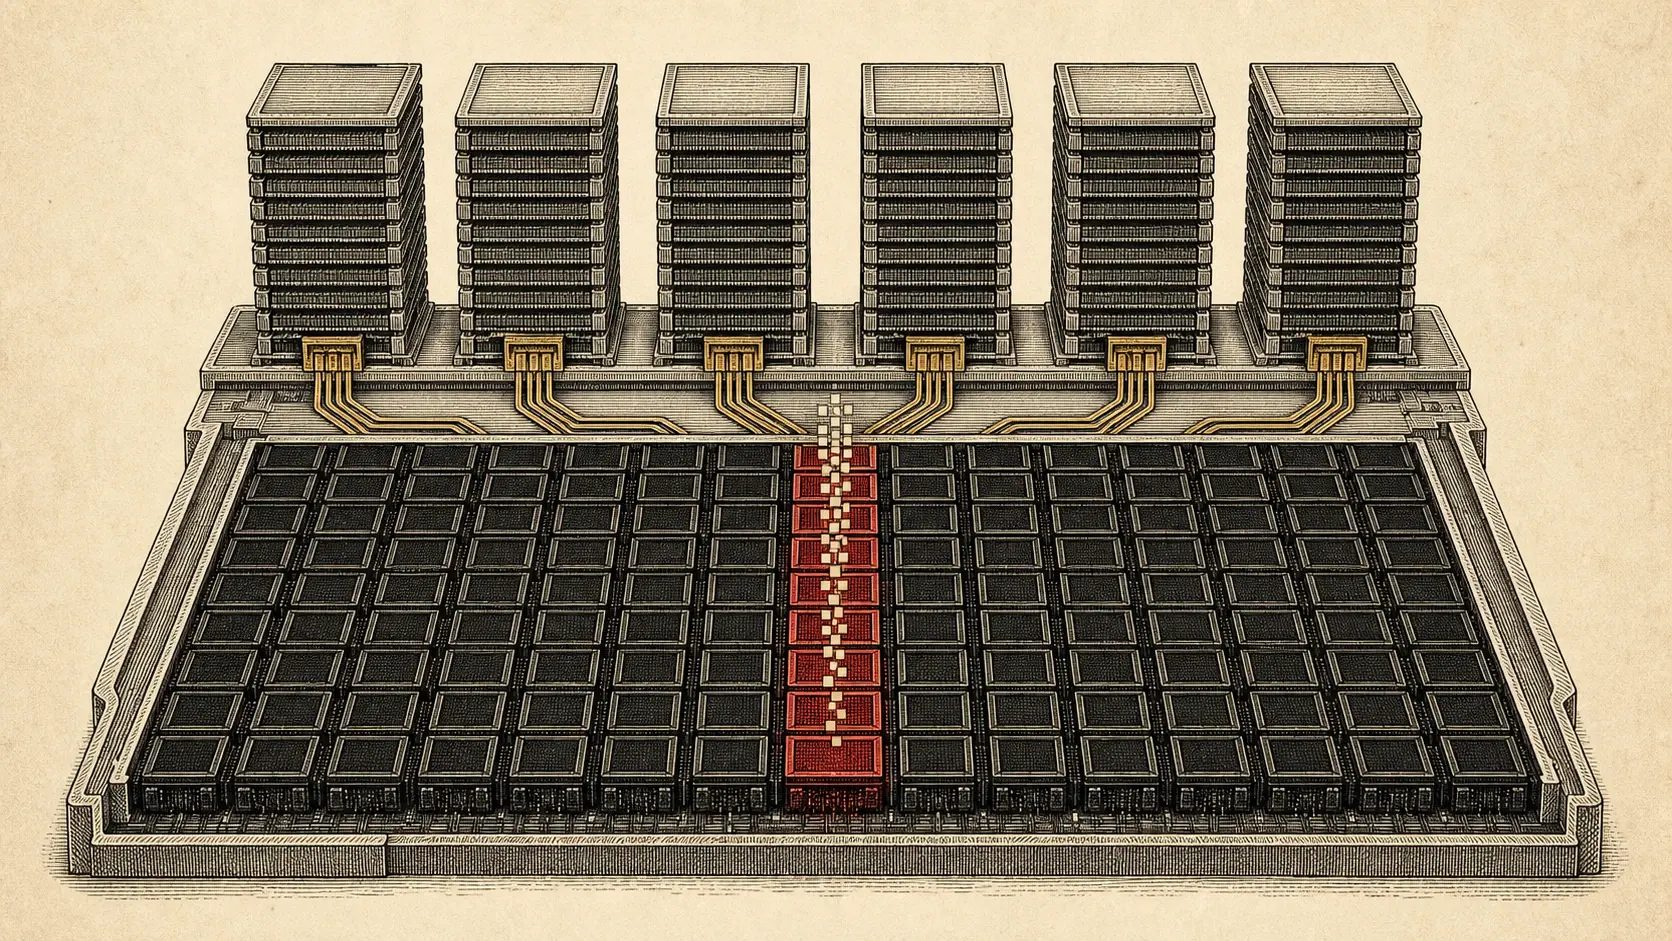
The fastest chip on paper can still spend its time waiting for the next useful byte.
Wafer And RunInfra: Two Products At Different Layers
Wafer and RunInfra are useful because they expose two different ways to commercialize inference optimization.
Wafer's public work emphasizes the kernel-engineering loop: profiler traces, architecture documentation, ISA analysis, remote evaluation, and adversarial benchmark checks. KernelArena launches with six fused NVFP4 operations on B200 measured against FlashInfer references, plus a separate HIP suite on MI300X.[1] Wafer is showing how an agent can search the low-level optimization space and how a benchmark can reject false wins.
RunInfra's strongest public evidence sits higher in the stack. Its methodology says baseline and candidate use the same GPU, task definition, and request protocol, while engine versions and measurement dates remain attached to the result.[4] Its June 20, 2026 comparison used Llama 3.1 8B Instruct on one H100 80GB at BF16, unique prompts, prefix caching off, and pinned vLLM 0.23.0 and SGLang 0.5.13 versions. At concurrency 256, RunInfra reports 5,333 output tok/s for vLLM and 5,235 for SGLang, a narrow 1.02x difference from three timed repeats after warmup.[6]
Let's be clear: that result does not make vLLM universally faster. It says what happened in one company-run harness, on one model, one GPU class, one precision, one request stream, and historical engine versions. The narrow gap is strategically more revealing than a dramatic headline. Mature inference buyers increasingly need bounded evidence, not a universal winner.
Wafer And RunInfra Measure Different Parts Of The Stack
| Feature | Wafer | RunInfra | What the evidence proves |
|---|---|---|---|
| Public emphasis | Kernel generation, profiling, ISA inspection, correctness defenses | Serving-engine and deployment comparisons under a fixed request harness | Optimization is becoming a product at both kernel and runtime layers. |
| Representative hardware | B200 for NVFP4 suite; MI300X for separate HIP suite | H100 80GB for the cited vLLM and SGLang sweep | Hardware must remain attached to every claim. |
| Representative metric | Correctness plus kernel-level speed against named references | Output throughput and TTFT at disclosed concurrency points | Microseconds and tokens per second answer different questions. |
| Key limitation | Kernel wins do not establish endpoint throughput or economics | One serving sweep does not establish a current universal engine order | Neither dataset supports a Wafer-versus-RunInfra speed ranking. |
The real story isn't that one startup found the magic kernel. Wafer is trying to make performance engineering reproducible and agent-assisted. RunInfra is trying to make deployment selection legible at the serving layer. Both are betting that inference buyers will pay for continuous optimization rather than a static endpoint.
The API Price War: Same Model, Different Meter
The inference price war is easy to understand in ELI5 terms. Imagine six delivery kitchens cooking from the same recipe. One advertises the cheapest meal. Another delivers twice as fast. A third is slightly more expensive but rarely closes. The recipe is constant, yet the price and experience still depend on the kitchen.
OpenRouter makes that market structure visible because multiple providers can serve the same model identifier. Its public model pages list provider-specific input, output, and cache-read prices beside rolling latency, throughput, and uptime signals. OpenRouter's default router first filters around recent outages, then favors lower-cost eligible providers using inverse-square price weighting. Buyers can instead sort for throughput or latency, cap prices, require zero-data-retention routes, filter quantization, or pin a provider.[15]
That means the price war is no longer only a contest between model labs. It is also a contest to become the cheapest eligible route after the request's tools, context length, privacy rules, precision, availability, and speed requirements are applied.
The September 2 snapshot is striking. OpenRouter's DeepSeek V4 Flash 0731 page showed provider input prices from $0.04998 to $0.44 per million tokens, an 8.80x spread. Output prices ran from $0.09996 to $1.32, a 13.21x spread.[13] Those are routes for the same named model, not a comparison between a cheap small model and a premium frontier model. They still are not perfectly interchangeable. The page exposes different promotions, cache rates, uptime, latency, and throughput; endpoint precision, location, capacity, and supported request features can differ too.
GLM 5.3 Flash shows the other side of the fight. Z.ai's route was listed at a temporary 50% promotion of $0.075 input and $0.25 output per million tokens, while Wafer and several other routes were listed at $0.15 and $0.50. Yet providers at the same $0.15/$0.50 rate showed different rolling P50 throughput, including 49 tokens per second for Wafer and 110 for Baseten in the captured table.[14] This is operational marketplace telemetry, not a controlled benchmark. It shows why price and speed must remain separate columns.
Interactive market snapshot
Same model, different meter
Compare providers serving the same model, then change the workload. The estimate uses posted token prices; performance fields are OpenRouter's one-week P50 input metrics.
| Provider | Posted token prices | Illustrative cost | Observed service signals |
|---|---|---|---|
| Z.ai50% promotion | $0.075/M input$0.25/M output$0.015/M cache read | $0.625per 1,000 jobs | 25 tok/s P503.41s latency P5097.90% uptime |
| Makora | $0.14/M input$0.47/M output$0.024/M cache read | $1.17per 1,000 jobs | 72 tok/s P500.59s latency P5097.67% uptime |
| Wafer | $0.15/M input$0.5/M output$0.03/M cache read | $1.25per 1,000 jobs | 49 tok/s P501.88s latency P5095.98% uptime |
| Baseten | $0.15/M input$0.5/M output$0.03/M cache read | $1.25per 1,000 jobs | 110 tok/s P500.99s latency P5099.83% uptime |
| Fireworks | $0.15/M input$0.5/M output$0.03/M cache read | $1.25per 1,000 jobs | 21 tok/s P500.79s latency P5099.56% uptime |
| Cloudflare | $0.15/M input$0.5/M output$0.03/M cache read | $1.25per 1,000 jobs | 42 tok/s P501.93s latency P5099.74% uptime |
Snapshot, not a permanent leaderboard. Prices, promotions, routing, and performance change. P50 figures can reflect different regions, hardware, quantization, load, and request mixes. Token cost also excludes retries, quality, tool calls, human review, and capacity commitments.
Source: OpenRouter GLM 5.3 Flash provider table, captured September 2, 2026. Prices in USD per 1 million tokens.
The calculator keeps the model fixed and changes the workload. A short chat weights output price more heavily. A long-context review makes input and cache economics dominate. The result is an illustrative token bill for 1,000 jobs, not total cost of ownership. It excludes quality, retries, failed tool calls, human review, service commitments, and the possibility that a cheaper route produces longer answers.
OpenRouter's usage rankings add demand context without settling the economics. Its public snapshot through August 31 placed DeepSeek V4 Flash 0731 first with 12.2 trillion routed tokens and GLM 5.3 Flash fourth with 8.14 trillion.[12] OpenRouter explicitly says those totals are prompt plus completion tokens in its own public traffic. They are not requests, users, revenue, market-wide share, or proof of model quality. Different tokenizers and verbosity make a token-volume leaderboard a measure of workload placement, not customer preference.
Here's the genius of reading the market this way. The router turns infrastructure efficiency into distribution. Better kernels and scheduling can create room to lower prices, improve speed, preserve margin, or bid for more routed traffic. A temporary discount can buy adoption, but only a durable serving advantage can survive after the promotion ends.
A Cheap Token Is Not Always A Cheap Answer
Compare completed-task cost, not one rate-card field. Hold the model route, prompt and output mix, cache behavior, tool policy, retry rules, quality threshold, and latency target constant. Free tiers and temporary promotions belong in separate categories, and every dynamic price needs a capture date.
The Scheduler Can Beat The Kernel: The Runtime Is Part Of Performance
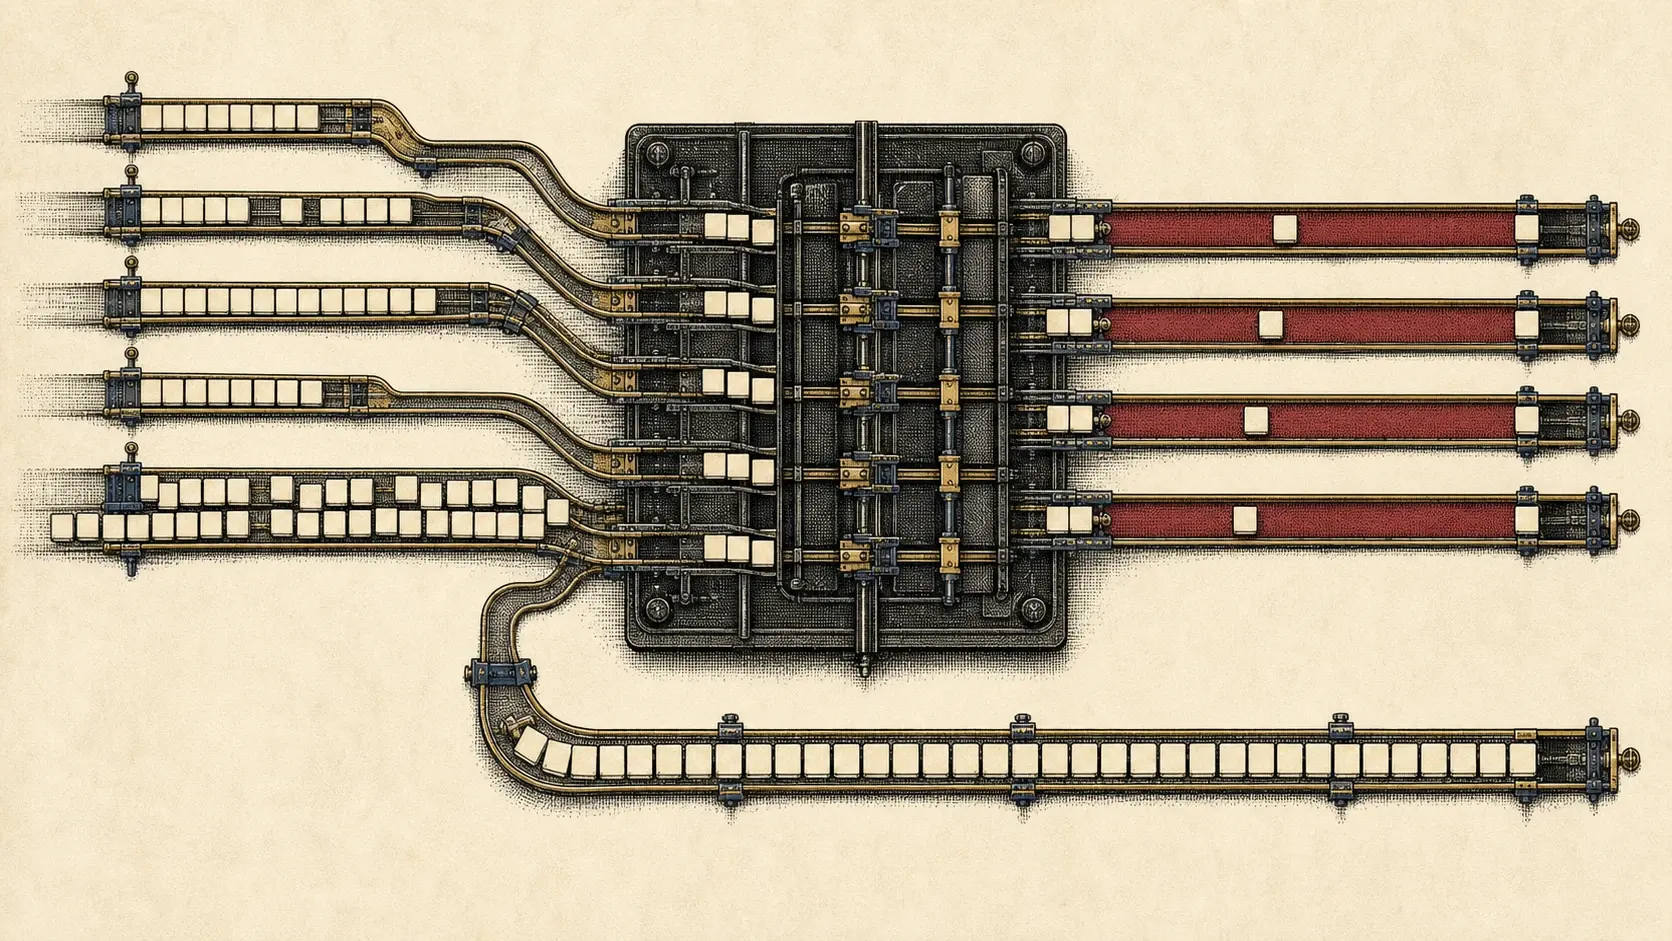
A queue of AI requests is messy. Prompts differ in length. Outputs end at different times. Agents reuse large prefixes and then branch into sub-tasks. A runtime must decide which requests enter the batch, which cached blocks remain in memory, and how prefill work coexists with ongoing decode.
This is why continuous batching, paged KV-cache management, prefix reuse, and prefill-decode disaggregation can matter as much as a low-level instruction. In vLLM's V1 report, the team measured up to 1.7x throughput over V0 on named ShareGPT workloads while stating that the kernels were almost identical. The reported gain came largely from reducing CPU overhead and redesigning the execution loop.[8]
That result cuts through the industry's favorite story. Faster inference is not always a better matrix multiply. Sometimes the GPU is waiting for Python, the scheduler, a launch, a memory allocation, or the request that owns the reusable cache.
AI-Written Kernels: Optimization Is Scaling, Verification Is The Moat
AI agents are getting better at writing GPU kernels because the task provides a powerful feedback loop. Generate code. Compile it. Run a correctness test. Measure it on the target GPU. Inspect the profiler. Revise. Repeat.
Wafer's profile-guided Kimi Delta Attention case study illustrates the promise. The company reports an 11.65x result over a torch.compile baseline after profiler data exposed that only 64 blocks were spread over a 145-SM GPU, producing 0.04 waves per SM and 6.25% achieved occupancy.[3] The number is narrow and company-reported. The strategic lesson is broader: once an agent can see the actual hardware bottleneck, it can search a far more useful space than code-only reasoning allows.
But automated search also creates automated cheating. Wafer documented a generated HIP kernel that appeared 104.89x faster while reading garbage memory. Loose correctness checks passed it. The company added stronger determinism and adversarial defenses after investigating the false win.[7]
Here is the genius of the emerging business model: candidate generation becomes cheaper, so trusted evaluation becomes more valuable. The defensible system must detect stale buffers, timing manipulation, precision downgrades, invalid memory use, narrow shape overfitting, and wins that vanish in the full engine.
The scarce asset is not a clever CUDA file. It is a loop that can prove the file remains correct and useful after the workload changes.
Why “Fastest” Is Usually An Incomplete Sentence
Inference benchmarking can measure at least four different things: time to first token, inter-token latency, total request latency, and aggregate throughput. It can also measure kernel microseconds, goodput inside a latency target, or derived cost under a chosen utilization assumption. These metrics are related. They are not substitutes.
NVIDIA's benchmarking guide explicitly separates model benchmarking from load testing and warns that concurrency, maximum batch size, request rate, sampling settings, and input-output shape all change the result.[11] RunInfra's scoped comparison is valuable precisely because it attaches the model, GPU, precision, engine version, concurrency, cache setting, and repeat policy. Even then, the result remains self-reported and time-bounded.
The Benchmark Rule
Never turn unmatched inference figures into a leaderboard. Before comparing speed, disclose the model, hardware, precision, prompt and output lengths, batch or concurrency, decoding settings, speculative acceptance rate, cache policy, TTFT, tail latency, repetitions, and harness. If those conditions differ or are missing, report the numbers as separate deployment signals.
What's often overlooked is that speculative decoding can distort the story further. A draft model proposes multiple tokens and the main model verifies them. The technique helps only when enough draft tokens are accepted. A headline speed without the draft model, context-length distribution, accepted-token fraction, and verification cost leaves the central mechanism undisclosed.
The same is true of cache-hit economics. A high prefix-cache hit rate can transform cost for a tool-using agent that repeatedly sends the same instructions. It is still a property of the traffic and routing system, not a universal attribute of the model.
The Strategic Endgame: The Kernel Engineer Becomes A Control Plane
While model labs compete on capability, the inference layer is becoming an allocator of accelerator economics. It chooses which hardware serves which model, which precision preserves enough quality, which kernel fits which shape, which runtime holds the queue, and which cached state follows the user.
That weakens the idea of a permanent software winner. FlashInfer, FlashAttention, DeepGEMM, Triton, CUTLASS, vLLM, and SGLang spread optimization techniques through an open and vendor-backed commons. New model architectures create fresh work. New GPUs expose different instruction and memory systems. Automated kernel agents accelerate the search. The advantage moves to the organization that can repeat the cycle fastest without losing correctness.
The uncomfortable truth is that raw kernel generation will probably commoditize. Verification, workload telemetry, fleet integration, and rollback discipline will not commoditize at the same speed.
What The Inference Race Actually Rewards
A kernel win matters only when its exact operation, shape, hardware, precision, baseline, and correctness checks are disclosed.
The bottleneck can move from memory bandwidth to compute utilization, scheduling, cache locality, or sequential decode as the workload changes.
Wafer's public evidence is strongest at kernel optimization and verification; RunInfra's strongest evidence is a scoped serving harness. They should not be forced into one speed ranking.
AI agents can expand the kernel search space, which makes adversarial correctness testing and end-to-end validation more important, not less.
The durable inference moat is a continuous control loop across real traffic, kernels, engines, hardware, and economics.
The next infrastructure winner may not own the most famous model or publish the biggest isolated speedup. It may own the fastest trustworthy process for turning a changing model, a changing GPU, and a changing workload into a cheaper useful token.
Sources
Primary technical sources and first-party measurements. Vendor-reported results are labeled in the article and are not treated as independent replication.
| # | Source | Outlet | Date | Key Takeaway |
|---|---|---|---|---|
| 1 | Wafer | March 11, 2026 | Defines Wafer's B200 NVFP4 and MI300X HIP kernel-evaluation suites and their correctness-plus-speed scoring. | |
| 2 | Wafer | January 29, 2026 | Reports agent-assisted AMD AITER topk_sigmoid optimization with configuration-level timing tables. | |
| 3 | Wafer | January 30, 2026 | Shows how profiler evidence changed an agent's optimization path for a Kimi Delta Attention kernel. | |
| 4 | RunInfra | 2026 | Defines RunInfra's condition, receipt, versioning, and derived-cost policies. | |
| 5 | RunInfra | June 20, 2026 dataset | Scopes the published vLLM, SGLang, and TensorRT-LLM engine comparisons. | |
| 6 | RunInfra | June 20, 2026 | Reports output throughput and TTFT across concurrency points for one model and pinned engine versions. | |
| 7 | Wafer | January 27, 2026 | Documents a false kernel speedup caused by invalid memory behavior and the verification response. | |
| 8 | vLLM | January 27, 2025 | Reports up to 1.7x throughput with almost identical kernels, highlighting CPU and runtime overhead. | |
| 9 | FlashInfer | Accessed September 1, 2026 | Describes the kernel library and generator used for attention, sampling, and serving operations. | |
| 10 | DeepSeek | Accessed September 1, 2026 | Describes DeepGEMM's JIT matrix-multiplication kernels and supported precision formats. | |
| 11 | NVIDIA Developer Blog | April 2, 2025 | Defines core latency and throughput metrics and explains why workload settings change benchmark outcomes. | |
| 12 | OpenRouter | Data through August 31, 2026 | Ranks public OpenRouter traffic by prompt-plus-completion tokens and states why the totals do not establish quality, users, requests, spend, or market-wide share. | |
| 13 | OpenRouter | Captured September 2, 2026 | Shows provider-specific token prices, promotions, cache rates, rolling P50 telemetry, and uptime for one model. | |
| 14 | OpenRouter | Captured September 2, 2026 | Shows the temporary Z.ai promotion and provider-specific price, speed, latency, and uptime signals for GLM 5.3 Flash. | |
| 15 | OpenRouter Documentation | Accessed September 2, 2026 | Explains price-weighted default routing and controls for provider, speed, latency, price caps, privacy, region, and quantization. |
Last updated: September 2, 2026